<gui-heatmap />
Example of a table from the backend
ts
@expose
fn heatmapTable() {
var table = Table::new(12);
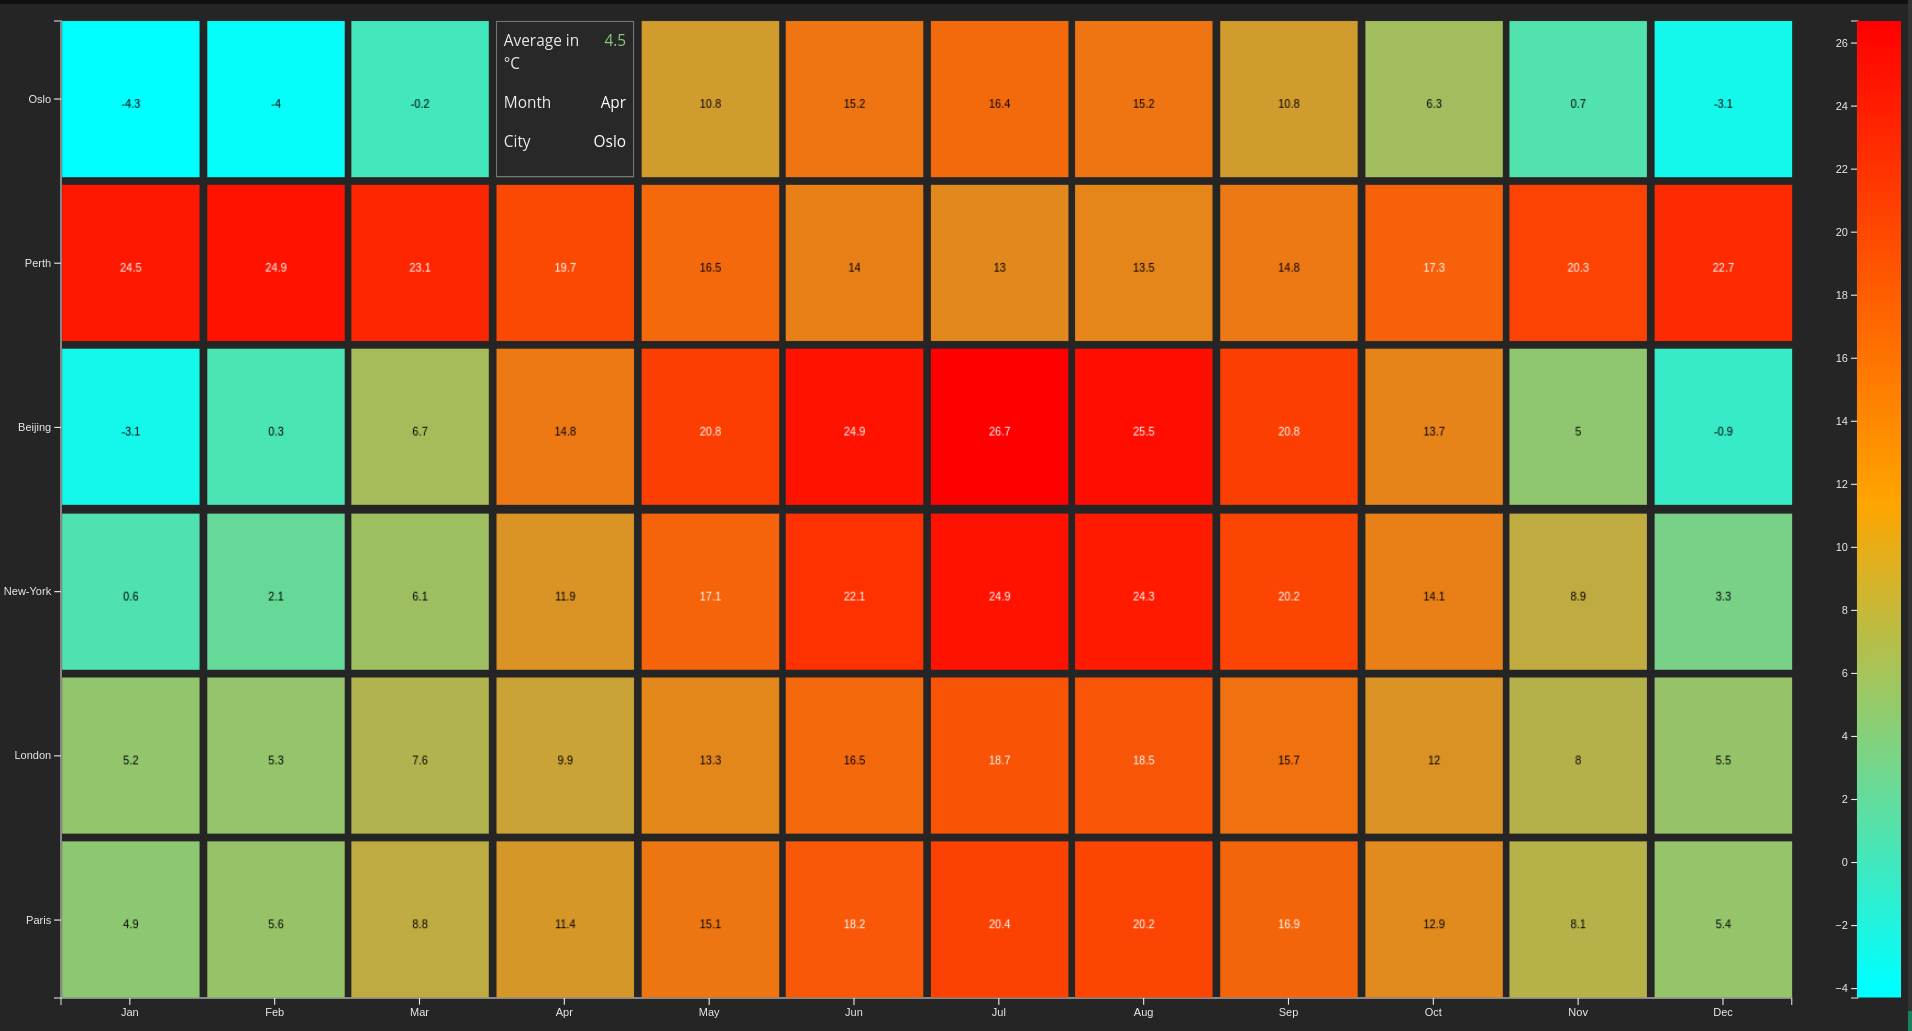
// ["Jan", "Feb", "Mar", "Apr", "May", "Jun", "Jul", "Aug", "Sep", "Oct", "Nov", "Dec"];
var paris = [4.9, 5.6, 8.8, 11.4, 15.1, 18.2, 20.4, 20.2, 16.9, 12.9, 8.1, 5.4];
var london = [5.2, 5.3, 7.6, 9.9, 13.3, 16.5, 18.7, 18.5, 15.7, 12.0, 8.0, 5.5];
var newyork = [0.6, 2.1, 6.1, 11.9, 17.1, 22.1, 24.9, 24.3, 20.2, 14.1, 8.9, 3.3];
var beijing = [-3.1, 0.3, 6.7, 14.8, 20.8, 24.9, 26.7, 25.5, 20.8, 13.7, 5.0, -0.9];
var perth = [24.5, 24.9, 23.1, 19.7, 16.5, 14.0, 13.0, 13.5, 14.8, 17.3, 20.3, 22.7];
var oslo = [-4.3, -4.0, -0.2, 4.5, 10.8, 15.2, 16.4, 15.2, 10.8, 6.3, 0.7, -3.1];
var cities = [paris, london, newyork, beijing, perth, oslo];
for (row, city in cities) {
for (col, temp in city) {
table.set(row, col, temp);
}
}
return table;
}@expose
fn heatmapTable() {
var table = Table::new(12);
// ["Jan", "Feb", "Mar", "Apr", "May", "Jun", "Jul", "Aug", "Sep", "Oct", "Nov", "Dec"];
var paris = [4.9, 5.6, 8.8, 11.4, 15.1, 18.2, 20.4, 20.2, 16.9, 12.9, 8.1, 5.4];
var london = [5.2, 5.3, 7.6, 9.9, 13.3, 16.5, 18.7, 18.5, 15.7, 12.0, 8.0, 5.5];
var newyork = [0.6, 2.1, 6.1, 11.9, 17.1, 22.1, 24.9, 24.3, 20.2, 14.1, 8.9, 3.3];
var beijing = [-3.1, 0.3, 6.7, 14.8, 20.8, 24.9, 26.7, 25.5, 20.8, 13.7, 5.0, -0.9];
var perth = [24.5, 24.9, 23.1, 19.7, 16.5, 14.0, 13.0, 13.5, 14.8, 17.3, 20.3, 22.7];
var oslo = [-4.3, -4.0, -0.2, 4.5, 10.8, 15.2, 16.4, 15.2, 10.8, 6.3, 0.7, -3.1];
var cities = [paris, london, newyork, beijing, perth, oslo];
for (row, city in cities) {
for (col, temp in city) {
table.set(row, col, temp);
}
}
return table;
}Usage
ts
const heatmap = document.createElement('gui-heatmap');

heatmap.setConfig({
  table: heatmapTable(),
  displayValue: true,
  markerColor: 'white',
  colorScale: {
    title: 'Average in °C',
    colors: ['cyan', 'orange', 'red'],
  },
  xAxis: {
    title: 'Month',
    labels: [
      'Jan',
      'Feb',
      'Mar',
      'Apr',
      'May',
      'Jun',
      'Jul',
      'Aug',
      'Sep',
      'Oct',
      'Nov',
      'Dec',
    ],
    innerPadding: 0.05,
  },
  yAxis: {
    title: 'City',
    labels: ['Paris', 'London', 'New-York', 'Beijing', 'Perth', 'Oslo'],
    innerPadding: 0.05,
  },
  tooltip: {
    position: 'in-place',
  },
});
const heatmap = document.createElement('gui-heatmap');
heatmap.setConfig({
table: heatmapTable(),
displayValue: true,
markerColor: 'white',
colorScale: {
title: 'Average in °C',
colors: ['cyan', 'orange', 'red'],
},
xAxis: {
title: 'Month',
labels: [
'Jan',
'Feb',
'Mar',
'Apr',
'May',
'Jun',
'Jul',
'Aug',
'Sep',
'Oct',
'Nov',
'Dec',
],
innerPadding: 0.05,
},
yAxis: {
title: 'City',
labels: ['Paris', 'London', 'New-York', 'Beijing', 'Perth', 'Oslo'],
innerPadding: 0.05,
},
tooltip: {
position: 'in-place',
},
});Properties for the heatmap
###Config
ts
export type HeatmapConfig = {
  table: TableLike;
  markerColor?: Color;
  /**
   * Displays the value centered in each square. Defaults to `false`.
   */
  displayValue?: boolean;
  tooltip?: HeatmapTooltip;
  xAxis: HeatmapAxis;
  yAxis: HeatmapAxis;
  colorScale?: HeatmapColorScale;
};
export type HeatmapConfig = {
table: TableLike;
markerColor?: Color;
/**
* Displays the value centered in each square. Defaults to `false`.
*/
displayValue?: boolean;
tooltip?: HeatmapTooltip;
xAxis: HeatmapAxis;
yAxis: HeatmapAxis;
colorScale?: HeatmapColorScale;
};Heatmap Axis
ts
export type HeatmapAxis = {
  /** Used in the tooltip */
  title?: string;
  /** */
  labels?: string[];
  /**
   * Sets the inner padding to the specified value which must be in the range [0, 1].
   * The inner padding determines the ratio of the range that is reserved for blank space between bands.
   *
   * The default setting is 0.
   */
  innerPadding?: number;
  /**
   * Sets the outer padding to the specified value which must be in the range [0, 1].
   * The outer padding determines the ratio of the range that is reserved for blank space before the first band and after the last band.
   *
   * The default setting is 0.
   */
  outerPadding?: number;
  hook?: (axis: d3.Axis<string>) => void;
}
export type HeatmapAxis = {
/** Used in the tooltip */
title?: string;
/** */
labels?: string[];
/**
* Sets the inner padding to the specified value which must be in the range [0, 1].
* The inner padding determines the ratio of the range that is reserved for blank space between bands.
*
* The default setting is 0.
*/
innerPadding?: number;
/**
* Sets the outer padding to the specified value which must be in the range [0, 1].
* The outer padding determines the ratio of the range that is reserved for blank space before the first band and after the last band.
*
* The default setting is 0.
*/
outerPadding?: number;
hook?: (axis: d3.Axis<string>) => void;
}Heatmap color scale
ts
export type HeatmapColorScale = {
  /** Used in the tooltip */
  title?: string;
  colors?: string[];
  range?: [number, number];
  type?: 'linear' | 'log';
  format?: string;
};
export type HeatmapColorScale = {
/** Used in the tooltip */
title?: string;
colors?: string[];
range?: [number, number];
type?: 'linear' | 'log';
format?: string;
};Tooltip
ts
export type HeatmapTooltip = {
  /**
   * The position of the tooltip.
   *
   * - `'follow'`: follows the mouse cursor
   * - `'in-place'`: replaces the hovered square with the tooltip content
   *
   * Defaults to `'follow'`.
   */
  position?: 'in-place' | 'follow';
  render?: (data: HeatmapData, cursor: Cursor) => void;
};
export type HeatmapTooltip = {
/**
* The position of the tooltip.
*
* - `'follow'`: follows the mouse cursor
* - `'in-place'`: replaces the hovered square with the tooltip content
*
* Defaults to `'follow'`.
*/
position?: 'in-place' | 'follow';
render?: (data: HeatmapData, cursor: Cursor) => void;
};Customization
css
gui-heatmap {
  /* margin variables, can only be pixels */
  --m-top: 10px;
  --m-right: 40px;
  --m-bottom: 25px;
  --m-left: 40px;

  /* color scale margin variables, can only be pixels */
  --color-scale-m-right: 40px;
}
gui-heatmap {
/* margin variables, can only be pixels */
--m-top: 10px;
--m-right: 40px;
--m-bottom: 25px;
--m-left: 40px;
/* color scale margin variables, can only be pixels */
--color-scale-m-right: 40px;
}